The Complete Guide to Using an Infographic Maker

Infographic video maker will allow you to bring to life the information you wish to communicate to your teams or your clients.
Whether internally, to brief your teams on the year’s results or statistics, to present a problem, to do e-learning, or on social networks, to proudly present your results or your new products, the animated infographic is now one of the most widely distributed contents thanks to infographic video maker. Depending on the animations you have prepared in this infographic, the video will allow you to set everything in motion, and to integrate different elements, whether GIFs, photo sequences or titles that you wish to highlight.
Remember these figures:
- 59% of executives prefer to have videos shared with them, rather than reading text,
- 95% of a video message is retained, compared to 10% of a text message,
- and 82% of internet traffic will be video by 2022.
But what is infographic video anyway?
First of all, a definition is necessary. In many companies, different information (key figures, objectives, market shares, results with voiceover, stats, tutorials, etc.) is grouped together in the form of diagrams, curves, illustrations, tables or images. These elements are often complex, even indigestible when they are scrolled one after the other in a meeting, to the detriment of your employees’ attention.
The animated infographic will allow you to put all these elements in motion, to present complex information in a tangible way, and easily understandable for the audience. With video infographics, you tell your story dynamically, and you combine visuals and audio. And of course, for training your new recruits (or older ones who want to improve their skills), it’s the ideal tool to save time and energy. Infographics are a way of putting useful information into images.
Note in particular that if you decide to integrate animated infographics into your marketing emails, this will increase your click-through rate, compared to an email without images or animation.
Your infographic made with infographic video maker for your business must be dynamic
For a long time, infographics, especially those shared on social networks, were static, i.e. they were not animated. For example, it could be an illustration of a ranking article (top 5 of…; top 3 of…) or a list (“the 5 rules of community management”…). In order for the information to be assimilated more quickly on social networks, the infographic was used to summarise the article in a few precise points, highlighting the main figures, with meaningful visuals. Very often, Internet users had to scroll to get to the next part of the information, but this was an integral part of the so-called static infographic.
But times have changed. Today, with the emergence of Instagram or Tik Tok, we know that video tends to take up all the space. Even if you are a company that prefers LinkedIn, a more professional social network, with a B2B target, video is recommended.
For example, the agency 99designs, which had just created the Bauhaus design, wanted to announce its arrival via a static infographic. But the agency finally opted for an animated infographic. See the result for yourself:
A little tip: you can also integrate micro-animations into a static infographic, in a fairly subtle way, as is the case here.
Animations made with infographic video maker should emphasise what the audience needs to remember
Before you get carried away by the creative fever, it is essential to agree internally on the key messages of this animated infographic, because the whole animation should revolve around this essential information to be retained. The animation should serve the message, not the other way around.
See instead this infographic produced by the Société Laitière des Volcans d’Auvergne (SLVA):
As you can see in this video, the figures important to be remembered by viewers are highlighted are thanks to :
- a rhythmic music,
- dynamic visuals and templates,
- nice icons,
- brand identity,
- a timeline,
- charts,
- data,
- graphs
- animations that accompany the figures, to better illustrate the point,
- and of course a sufficiently large font size so that the information takes up a maximum of space.
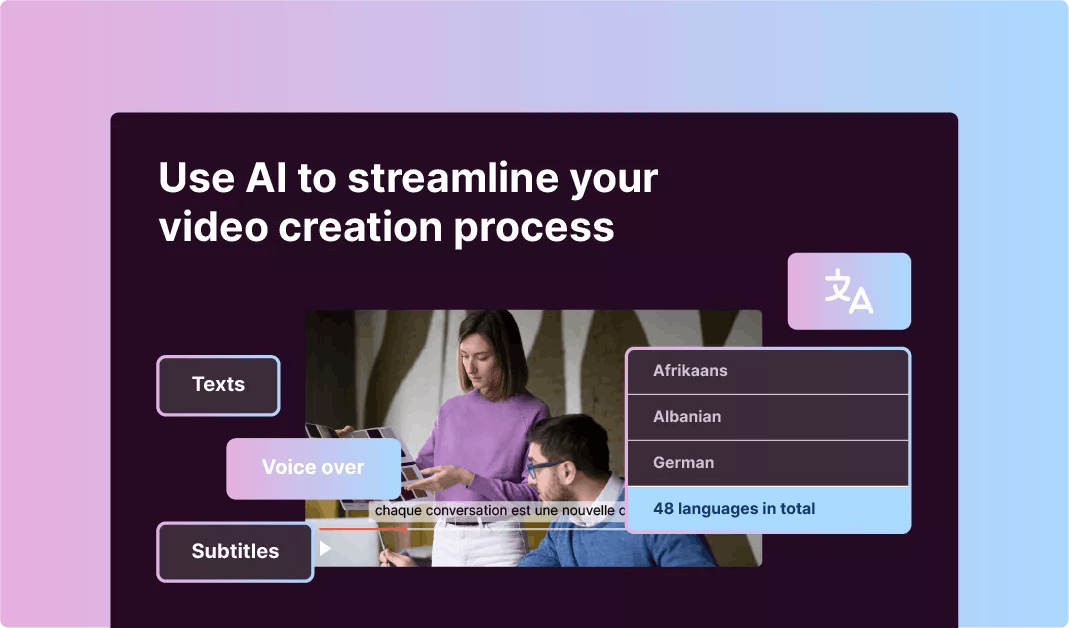
What about you? Would you like to make a good infographic, better than static infographics, with an infograhic maker? Where you could add subtitles, high-quality voice-over, charts, infographic designer, or any type of data visualisation, with motion graphics and brand guidelines? The process for making beautiful infographics for your customers on social media is pretty simple
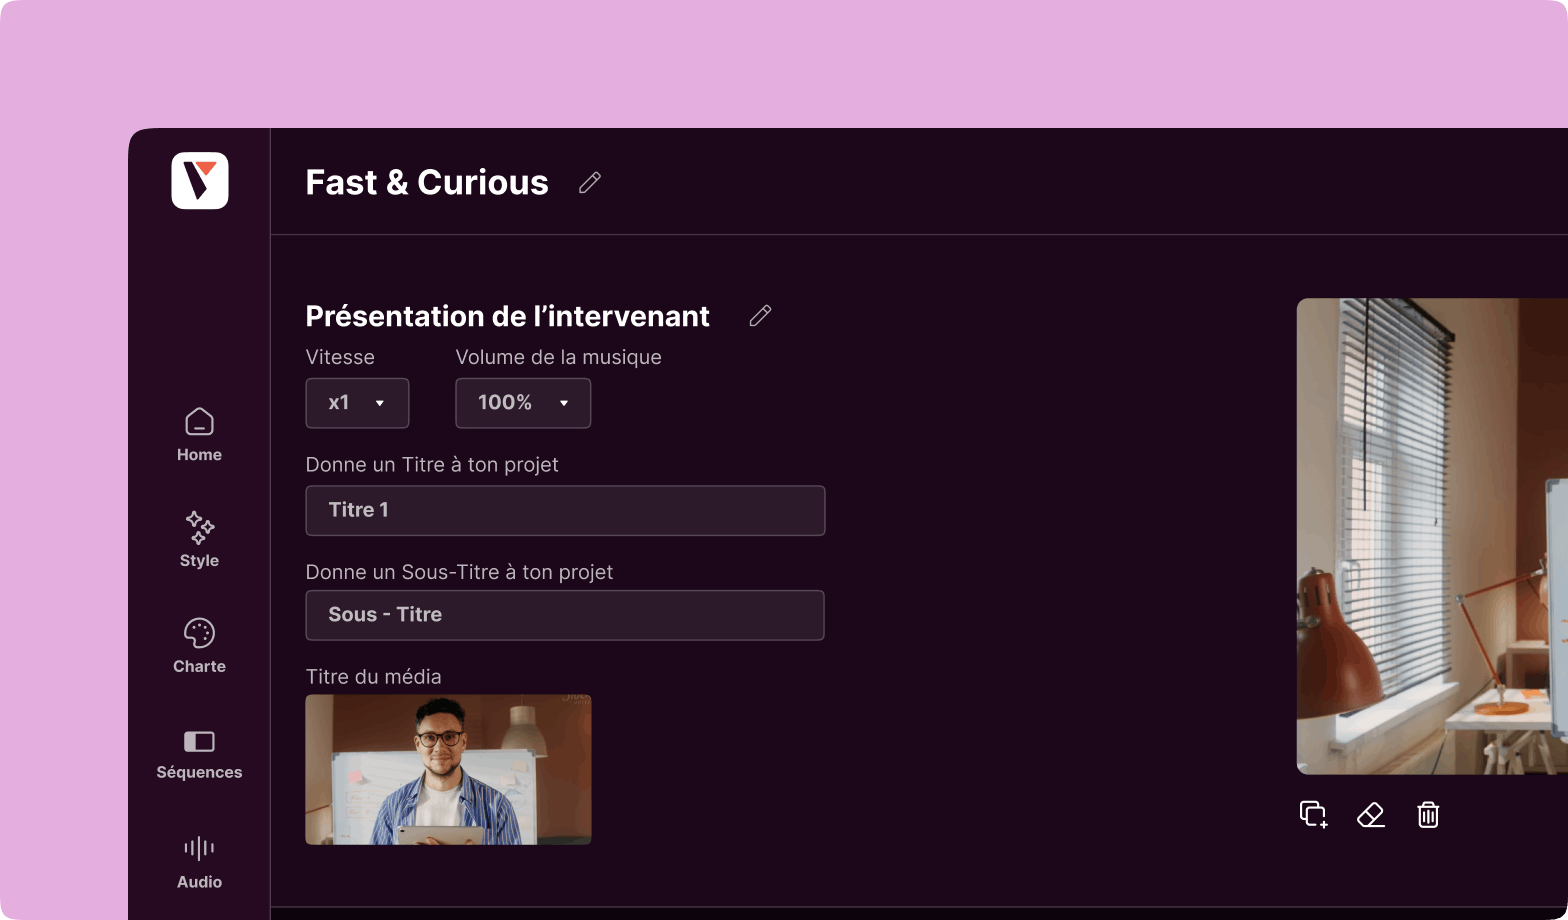
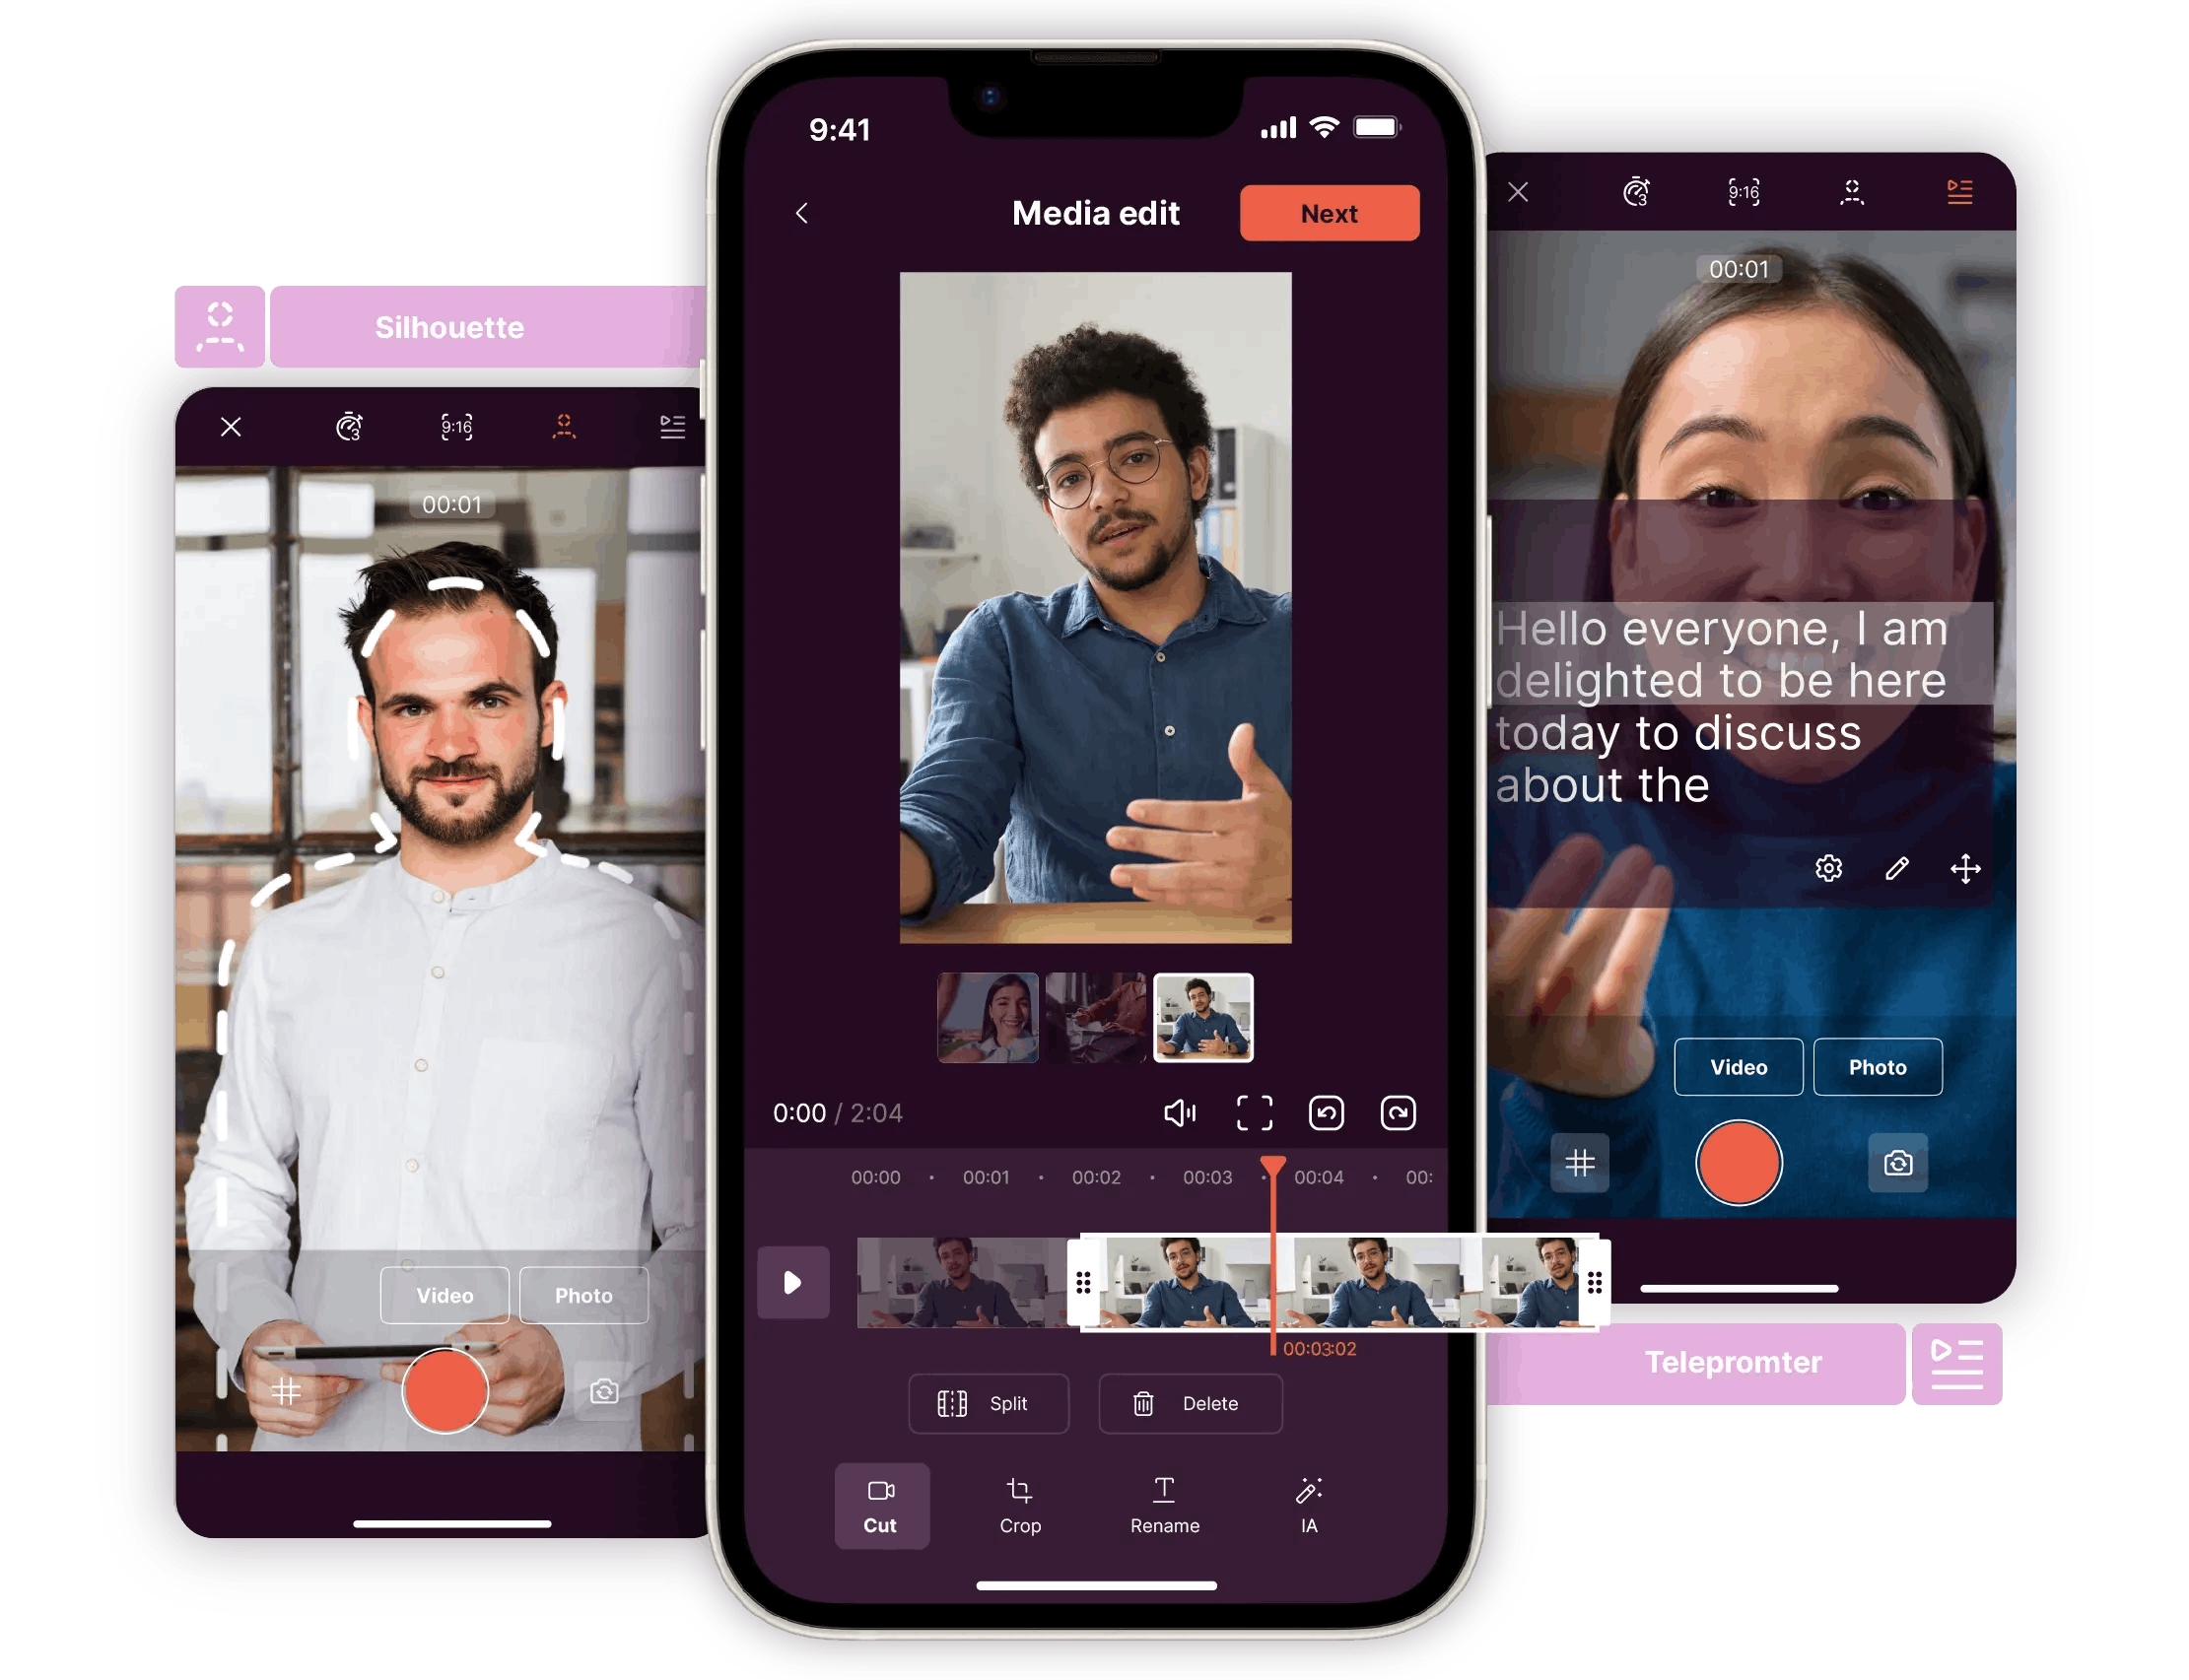
Ask for a demo of the Pitchy solution, easy tool made for non-designers who want to animate graphics. And watch our infographic examples.
Resources
